Please report any encountered problems here.
The presentation contains animations that require any of the following PDF viewers:
Acrobat Reader (version >= 7), PDF-XChange or Foxit Reader
Table of contents
Supplementary material are organized in the following way.- Abstract
- Two major contributions
- Interface (conditions & hyper-parameters)
- SG-t-SNE for Embedding of Sparse Stochastic Graphs/Matrices
- Performance
- Supplementary: relating the adjacency matrix to the graph embedding matrix in SG-t-SNE
- Precursor works
- Data sources
- Acknowledgments
Abstract
We introduce a nonlinear method for directly embedding large, sparse, stochastic graphs into low-dimensional spaces, without requiring vertex features to reside in or be transformed into, a metric space. Graph data and models are prevalent in real-world applications. Direct graph embedding is fundamental to many graph analysis tasks, in addition to graph visualization. We name the novel approach SG-t-SNE, as it is inspired by and builds upon the core principle of, a widely used method for nonlinear dimensionality reduction and data visualization. We also introduce t-SNE-Π, a high-performance software for 2D, 3D embedding of large sparse graphs on personal computers with superior efficiency. It empowers with modern computing techniques for exploiting in tandem both matrix structures and memory architectures. We present elucidating embedding results on two synthetic graphs and six real-world networks (one synthetic and four real-world networks are shown in the article).
Two major contributions
Method SG-t-SNE: Enabling sparse stochastic graph (SG) embedding
We introduce a novel nonlinear approach for directly embedding large, sparse, stochastic graphs into low-dimensional spaces, without requiring vertex features to reside in, or be transformed into, a metric space. There are a lot of stochastic graphs, in real-world applications, without feature vectors readily in a metric space or available for public use. Our approach, named SG-t-SNE, is inspired by and builds upon the core principle of t-SNE, which is widely used for nonlinear dimensionality reduction and data visualization. There are many variants of t-SNE. In SG-t-SNE, by a radical removal of the existing restrictions, we extend the use of t-SNE to the entire regime of stochastic graphs, no longer limited to distance-based \(k\)-nearest neighbor (\(k\)NN) graphs. SG-t-SNE is also equipped with a parameterized non-linear rescaling mechanism. It explores the sparsity to a much greater scope. In the case of a \(k\)NN graph, SG-t-SNE is capable of rendering much better embedding results than conventional t-SNE.
Software t-SNE-Π: Empowering SG-t-SNE with high-performance algorithms and implementations
We introduce a software t-SNE-Π. It accelerates 2D graph embedding up to \(5\times\) in execution time in comparison to the best among the existing t-SNE variants. More importantly, it enables 3D embedding of large sparse graphs on personal computers, with superior efficiency. We demonstrate that 3D embedding has greater capacity of preserving local and structural connectivity. Steerable visualization of all 3D embedding results is available. We present also experimental results on two biological networks, a social network created by Google, and an Amazon product network. The embedding results are characteristic of each and elucidating. They also manifest multiple advantages of the novel method SG-t-SNE with high-performance support by t-SNE-Π.
Interface (conditions & hyper-parameters)
Precursor algorithms
t-SNE
t-SNE web page by van der Maaten
The input to the conventional t-SNE algorithm is a high-dimensional dataset \(\mathbf{X} \in R^{N \times L}\), a distance function, the dimensionality \(d\) of the embedding space, and a user specified perplexity \(u\). All vertices are equalized by the conditional entropies, by determining the Gaussian parameter \(\sigma_i\):
\[ - \sum_{j} a_{ij} p_{j|i}(\sigma_i) \log( p_{j|i}(\sigma_i) ) = \log(u) \]
The implementation, t-SNE-BH, provided by van der Maaten is implemented in C, with wrappers available in multiple programming languages (MATLAB, Python, Julia, etc.). The implementation accepts any dimension \(d >= 1\), but the complexity and execution grows exponentially with respect to the dimensions of the embedding space.
FIt-SNE
FIt-SNE accelerates the t-SNE computations by approximating the repulsive forces through non-uniform fast Fourier transforms. The input parameters are similar to t-SNE-BH with the extra condition that \(1 \leq d \leq 2\); higher-dimensional embedding are not supported.
FIt-SNE emerged last year and is available 1D/2D embedding only. The execution time for 2D embedding with FIt-SNE is now dominated by the computation of the attractive term. FIt-SNE suffers further from exponential growth in memory demand, with respect to the dimensionality of the embedding space, due to zero padding for explicit conversion to periodic convolution.
The algorithm is implemented in C with wrappers available in multiple programming languages (similarly to t-SNE-BH).
New methods & software
SG-t-SNE
The input parameters for SG-t-SNE are the stochastic matrix \(\mathbf{P}_c\), the rescaling parameter \(\lambda\), and the dimensions of the embedding space \(1 \leq d \leq 3\).
Our algorithm SG-t-SNE follows the essential principle of t-SNE and removes the barriers in its conventional version. It admits any sparse stochastic graph \({\cal G} = (V, E, \mathbf{P}_c)\), including stochastic 𝑘NN graphs. We generate from \(\mathbf{P}_c\) a parameterized family of stochastic matrices, \(\mathbf{P}_c(\lambda)\), via nonlinear rescaling.
\[ \sum_{j} a_{ij} \, \phi\left( p_{j|i}^{\gamma_i} \right) = \lambda \]
Unlike the perplexity \(u\) in the conventional version of t-SNE, the parameter \(\lambda\) for SG-t-SNE exploits the sparsity without imposing any constraint. For the experiments shown in the supplementary material, \(\phi(x) = x\).
t-SNE-Π
With t-SNE-Π, we accelerate the entire gradient calculation of t-SNE and enable Spaceland (3D) embedding in shorter time than 2D embedding with FIt-SNE or t-SNE-BH. We overcome challenges at multiple algorithmic stages with innovative approaches to utilizing the matrix structure and the memory architecture in tandem. We not only expedite further the repulsive term computation with dense matrix QQ, but also accelerate the attractive term computation with sparse matrix PQ. We employ swift translocation of {y𝑖} in memory for the Q and vector elements used by both terms.
For sparse computations on modern computers with multi-level memory architectures, memory access latency dominates the execution time. We use data permutations, matrix permutations, and permutation factorization through and through, in order to conform to and utilize the memory hierarchy. Permutations are unaccounted for in arithmetic complexity; they play, however, the key role of increasing data locality, substantially, in every algorithmic building block. We use Π in t-SNE-Π to signify the role of permutations as well as the idea and techniques behind.
The algorithm is implemented in C with wrappers available in multiple programming languages (similarly to t-SNE-BH and FIt-SNE).
SG-t-SNE for Embedding of Sparse Stochastic Graphs/Matrices
Non-kNN graphs (four real-world networks)
SG-t-SNE admits sparse stochastic graphs with arbitrary degree distribution, which are not admissable by conventional t-SNE. Assume without loss of generality that there are no isolated single nodes. Rendering embeddings at different \(\lambda\) values. Showing better structure in 3D embeddings by t-SNE-Π.
Four real-world networks are shown:
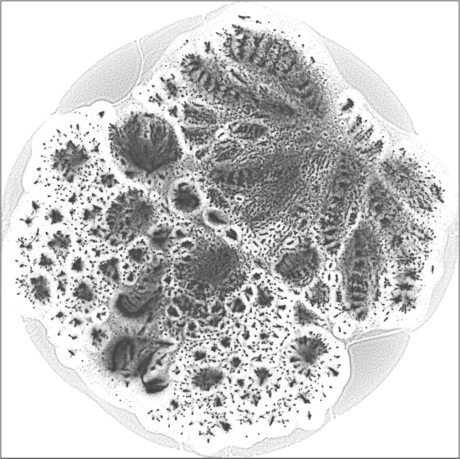
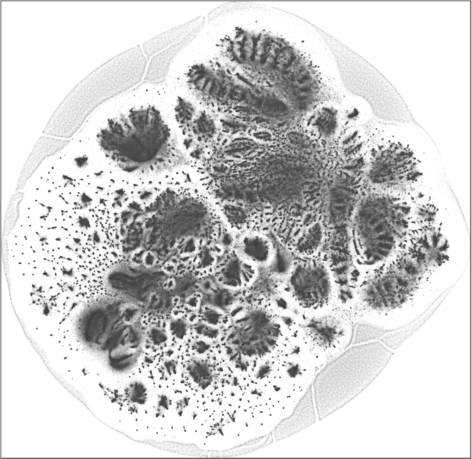
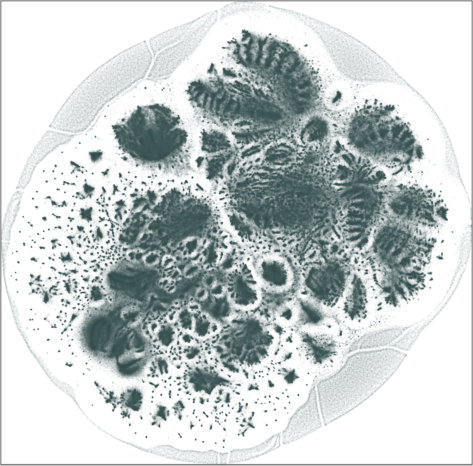
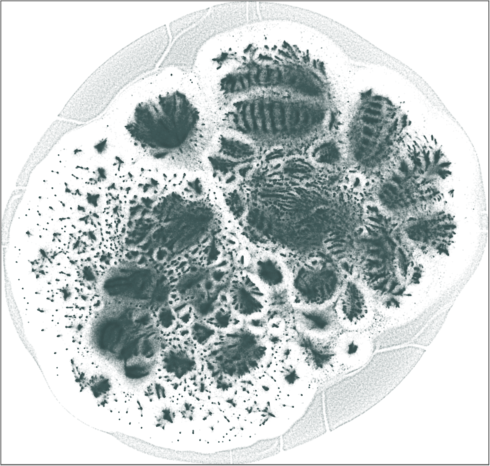
Amazon
Embedding of an Amazon product network, with \(n = 334{,}863\) products and \(m = 1{,}851{,}744\) edges, each edge
connects two products frequently purchased together. The graph is
not admissible to the conventional t-SNE. The embedding is by
SG-t-SNE, with \(l=8{,}000\)
iterations, starting with initial coordinates drawn from a random
Gaussian distribution, including \(l_e =
2{,}000\) early exaggeration iterations with \(\alpha = 12\).
The graph is comprised of multiple small-sized, strongly connected communities. The inter-connectivities are weak. The resulting embeddings depict the cluster structure of the product network, both in 2D and 3D.

|
|
The degree (log scale) histogram of the |
| SG-t-SNE | 2D embeddings | |
|---|---|
| Variation with the rescaling parameter \(\lambda\) | |
|
|
| \(\lambda=1.0\) | \(\lambda=10.0\) |
|
|
| \(\lambda=20.0\) | \(\lambda=80.0\) |
| SG-t-SNE | 3D embeddings | |
|---|---|
| Variation with the rescaling parameter \(\lambda\) | |
|

|
| \(\lambda=1.0\) | \(\lambda=10.0\) |
|
|
| \(\lambda=20.0\) | \(\lambda=80.0\) |
| SG-t-SNE | 1D embedding | ||
|---|---|---|
| Binary | 4-color scheme | Logarithmic |

|
|

|
| The weighted adjacency matrix of the Amazon graph. The vertices are ordered by the 1D embedding of SG-t-SNE-Π with \(\lambda = 10\). Each pixel corresponds to a \(180\times 180\) matrix block. Three different color schemes are shown. Left: Blocks containing at least one nonzero element are shown in black; Middle-Right: Each pixel is colored based on the number of nonzero elements inside the corresponding matrix block. Two different color schemes are used. The blocks on the off-diagonal areas are extremely sparse, containing zero to three nonzero elements. | ||
| SD-DP4 clustering result |
|---|

|
|
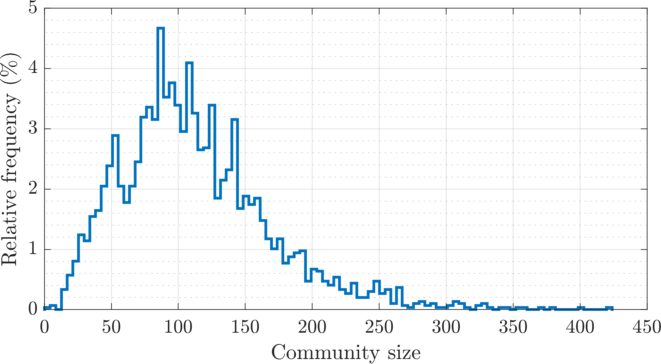
| The weighted adjacency matrix of the Amazon graph, after SD-DP4 clustering on the 1D SG-t-SNE embedding. The vertices are ordered by the clusters identified by SD-DP with \(k = 60\). Each pixel corresponds to a \(180\times 180\) matrix block. The number of edges outside of a \(5{,}400\) band (\(1.6\%\) of total vertices, shown in black) is \(41{,}507\) (\(4.5\%\) of total edges). The SD-DP algorithm identified \(2{,}978\) communities. The histogram of the community sizes is shown below the the adjacency matrix. |
DBLP
Embedding of author collaboration network, with \(n = 317{,}080\) authors and \(m = 2{,}416{,}812\) edges, each edge connects two authors that have collaborated on at least one article. The number of leaf nodes is \(43{,}181\). The graph is not admissible to the conventional t-SNE. The embedding is by SG-t-SNE, with \(l=8{,}000\) iterations, starting with initial coordinates drawn from a random Gaussian distribution, including \(l_e = 2{,}000\) early exaggeration iterations with \(\alpha = 12\).
The graph is comprised of multiple small-sized, strongly connected communities. The inter-community edges are weak. The resulting embeddings depict the clustered structure of the product network, both in 2D and 3D.
|
|
The degree (log scale) histogram of the |
| SG-t-SNE | 2D embeddings | |
|---|---|
| Variation with the rescaling parameter \(\lambda\) | |

|
|
| \(\lambda=1.0\) | \(\lambda=10.0\) |

|

|
| \(\lambda=20.0\) | \(\lambda=80.0\) |
| SG-t-SNE | 3D embeddings | |
|---|---|
| Variation with the rescaling parameter \(\lambda\) | |
|
|
| \(\lambda=1.0\) | \(\lambda=10.0\) |
|
|
| \(\lambda=20.0\) | \(\lambda=80.0\) |
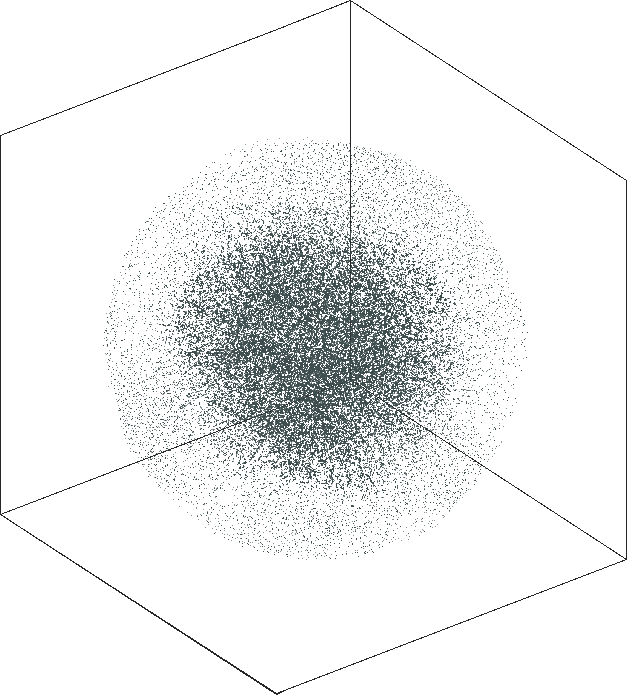
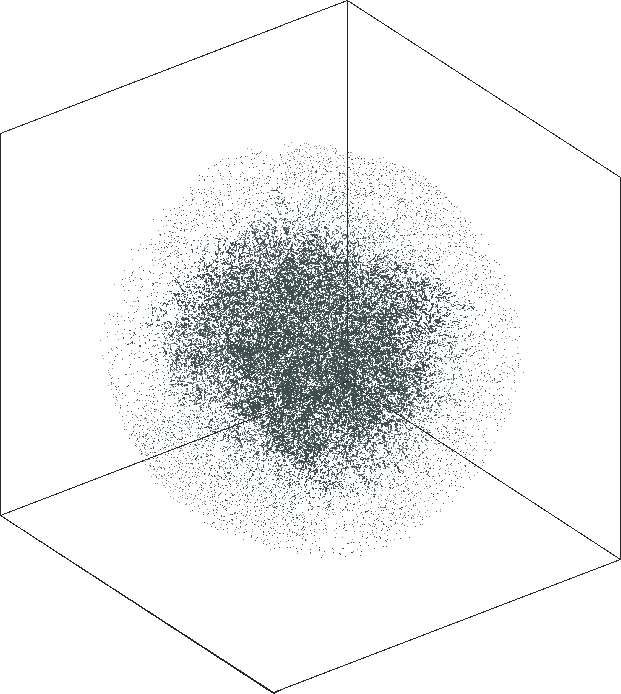
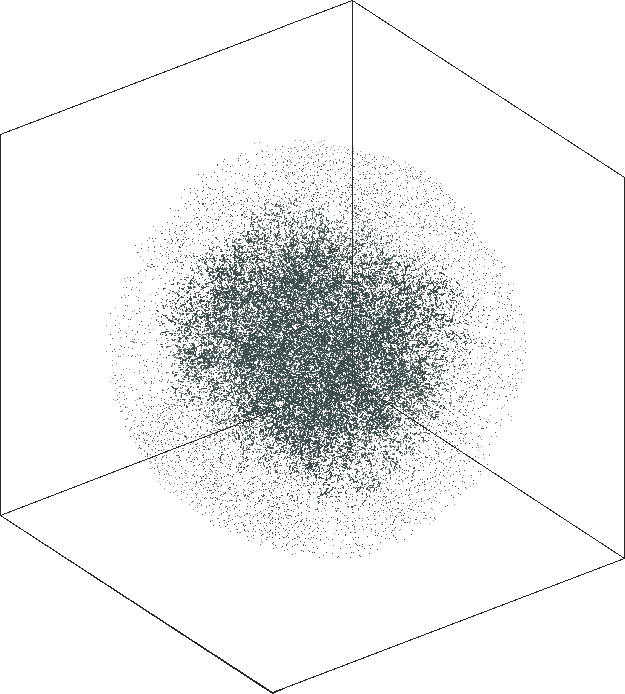
orkut
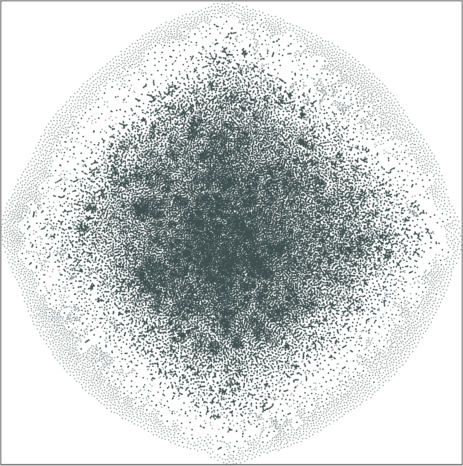
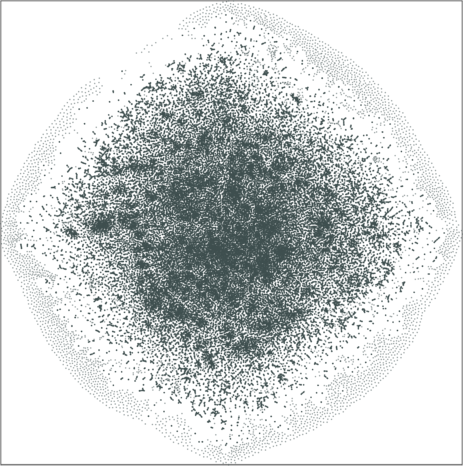
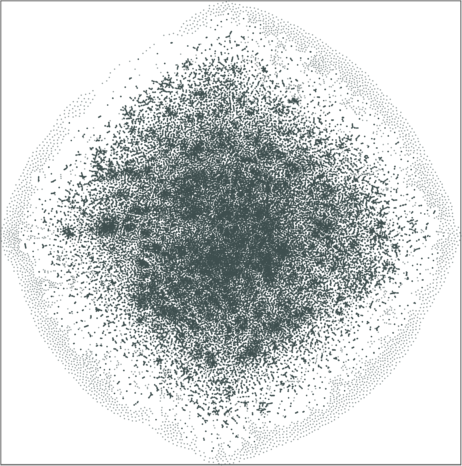
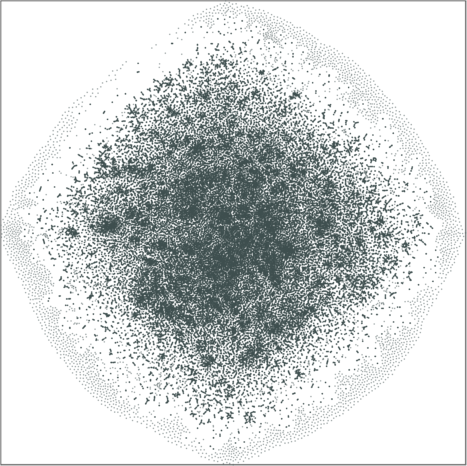
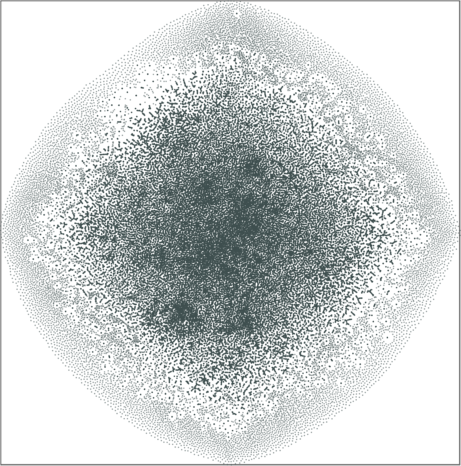
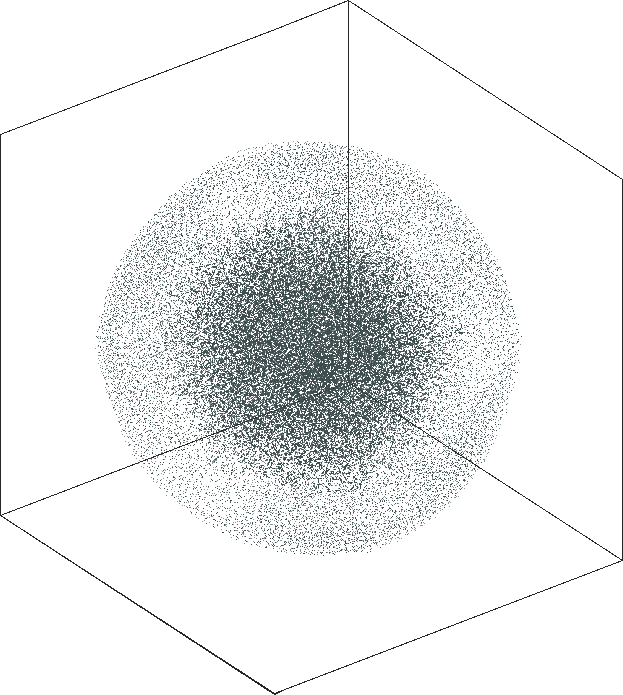
Spaceland (3D) and Flatland (2D) embedding of the friend social
network orkut as of 2012. The network has \(n = 3{,}072{,}441\) user nodes, \(m = 237{,}442{,}607\) friendship
links. The graph is not admissible to the conventional t-SNE. The
embedding is by SG-t-SNE using \(8{,}000\) iterations, with initial
coordinates drawn from a Gaussian random distribution.
|
The degree (log scale) histogram of the orkut social
network. The degree varies from \(1\) at the minimal (\(67{,}767\) leaf nodes) to \(33{,}313\) at the maximal. The
distribution resembles a log-normal distribution.
|
The 2D embedding takes only 50 minutes on a server with an Intel Xeon E5-2640v4 CPU and 256 GB of RAM. The vertex locations are structured, with entropy equal to \(7.64\). The leaf nodes (\(67{,}767\) of them) are in the halo-like peripheral area. The rest can be roughly put into two hemispherical regions, which may likely correspond to the largest user populations in two geographical areas, one is in and around Brazil, the other is in and around India and some other countries in Asia.
| SG-t-SNE | 2D embedding | |
|---|---|
| Variation with the rescaling parameter \(\lambda\) | |
|
|
| \(\lambda=1.0\) | \(\lambda=10.0\) |
|
|
| \(\lambda=20.0\) | \(\lambda=80.0\) |
| SG-t-SNE | 3D embedding | |
|---|---|
| Variation with the rescaling parameter \(\lambda\) | |
|
|
| \(\lambda=1.0\) | \(\lambda=10.0\) |
|
|
| \(\lambda=20.0\) | \(\lambda=80.0\) |
We show 20 of the largest sub-communities on the \(\lambda = 20\) 2D embedding. The communities are clearly separated in the top and bottom hemispheres. Some of the communities are tightly clustered together while others are spread out in the corresponding hemisphere.

|

|

|

|

|

|

|

|

|

|

|

|

|

|

|

|

|

|

|
|
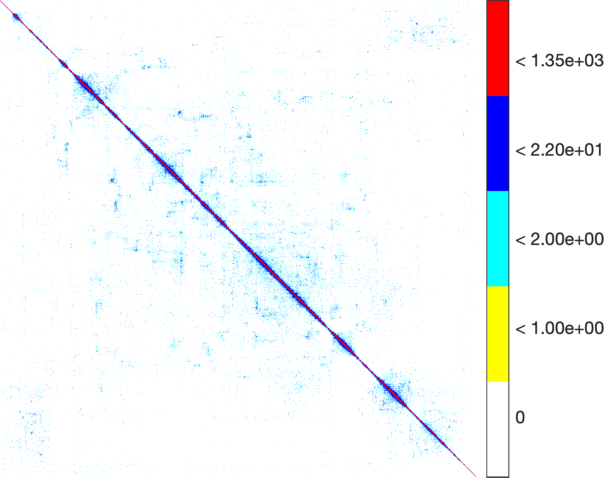
| SG-t-SNE | 1D embedding | |
|---|---|
| 4-color scheme | Logarithmic |

|
|
| The weighted adjacency matrix of the Orkut graph. The vertices are ordered by the 1D embedding of SG-t-SNE-Π with \(\lambda = 10\). Each pixel corresponds to a \(1{,}750\times 1{,}750\) matrix block. Each pixel is colored based on the number of nonzero elements inside the corresponding matrix block. Two different color schemes are used. The blocks on the two off-diagonal blocks are extremely sparse, containing zero to twelve nonzero elements. | |
LiveJournal
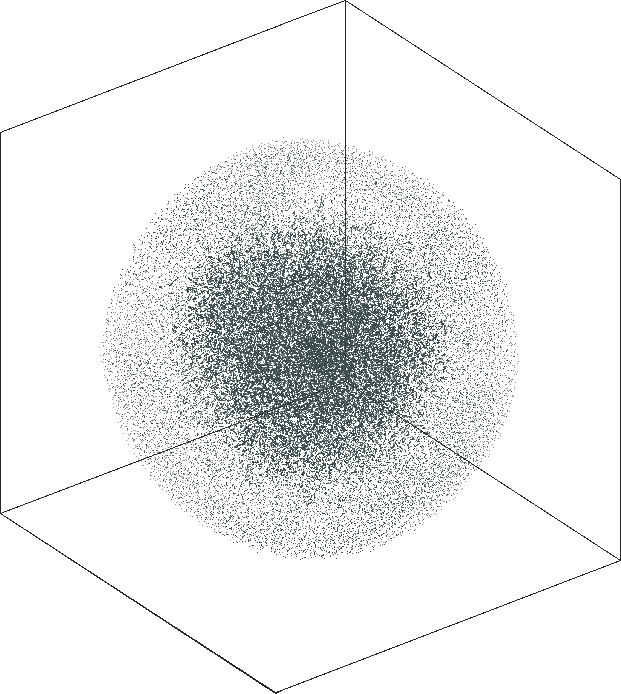
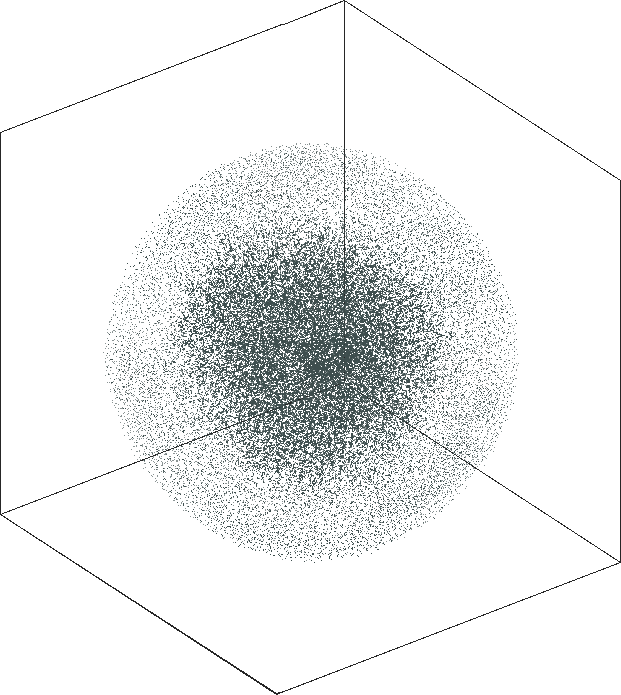
Spaceland (3D) and Flatland (2D) embedding of the
LiveJournal online community. The network has \(n = 3{,}997{,}962\) user nodes, \(m = 73{,}360{,}340\) friendship
links. The degree varies from \(1\) at the minimal (leaf nodes) to
\(14{,}815\) at the maximal. The
graph is not admissible to the conventional t-SNE. The embedding
is by SG-t-SNE using \(8{,}000\)
iterations, with initial coordinates drawn from a Gaussian random
distribution.
The graph has a hierarchical structure; the leaf nodes comprise the outer halo, while higher levels in the hierarchy reside in the denser areas of the embeddings. The tree-like structure is seen better in the 3D embeddings.
|
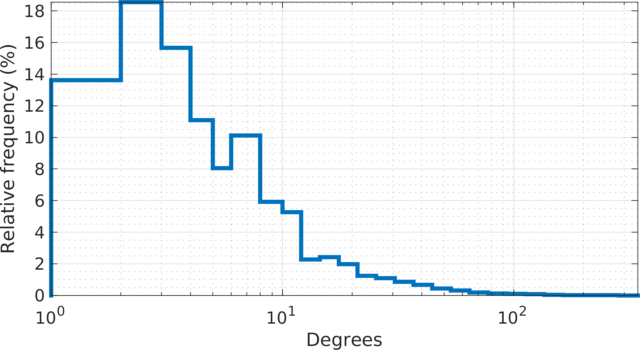
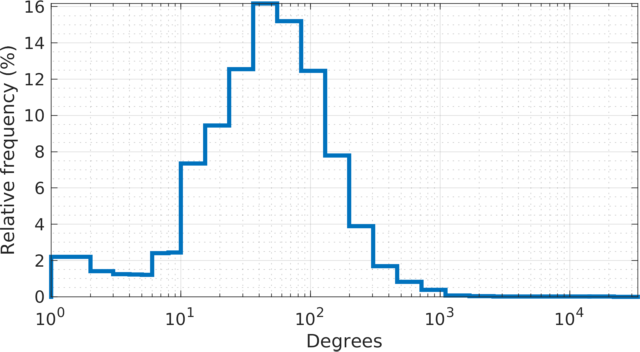
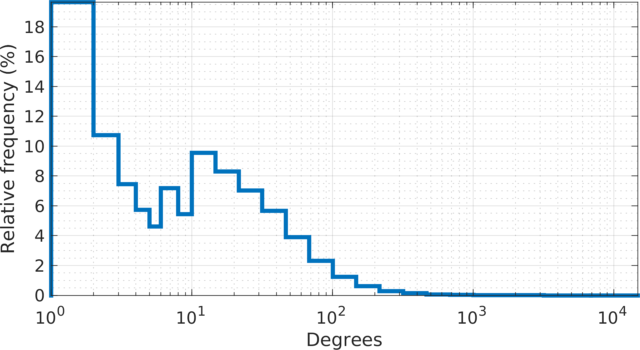
The degree (log scale) histogram of the LiveJournal
online community network, with relative frequencies. The degrees
show two peaks; one at 1-2 degrees and one at 10-20 degrees. More
than 18% of the users have one friendship link. There are 485 hub
users with more than 1,000 friendship links. The highest number of
links for a single user is 14,815.
|
| SG-t-SNE | 2D embeddings | |
|---|---|
| Variation with the rescaling parameter \(\lambda\) | |

|

|
| \(\lambda=1.0\) | \(\lambda=10.0\) |

|
|
| \(\lambda=20\) | \(\lambda=80\) |
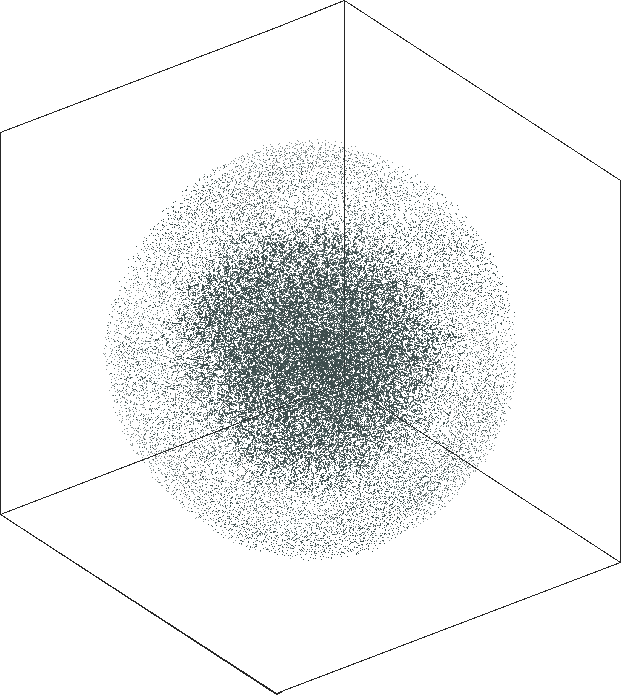
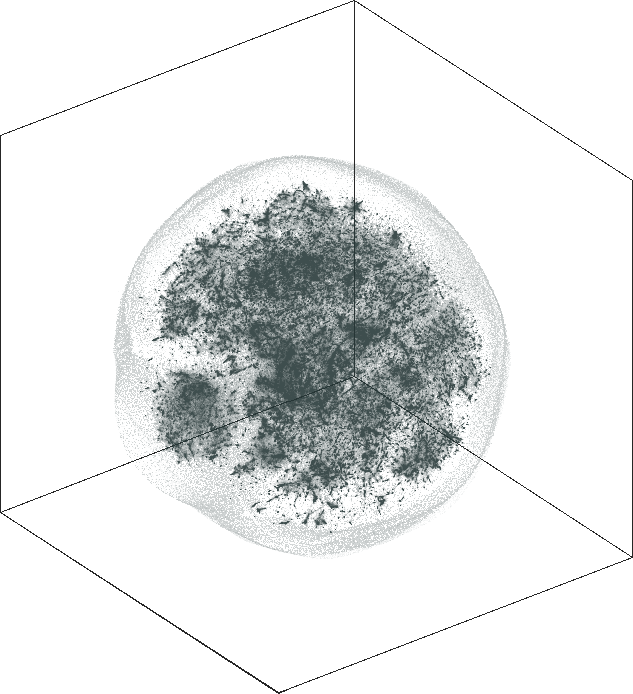
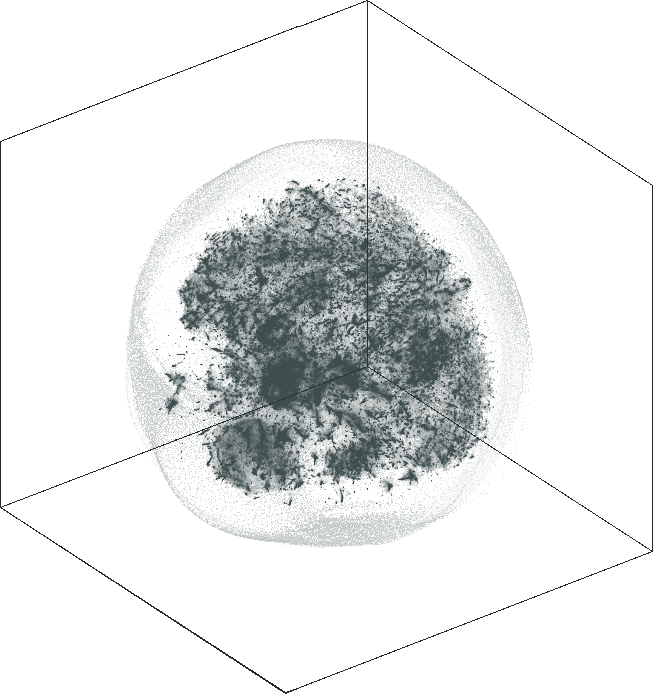
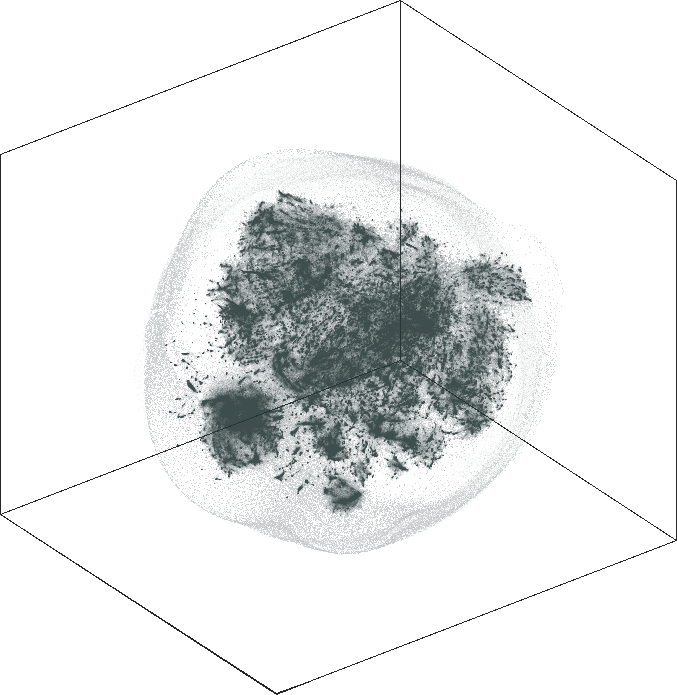
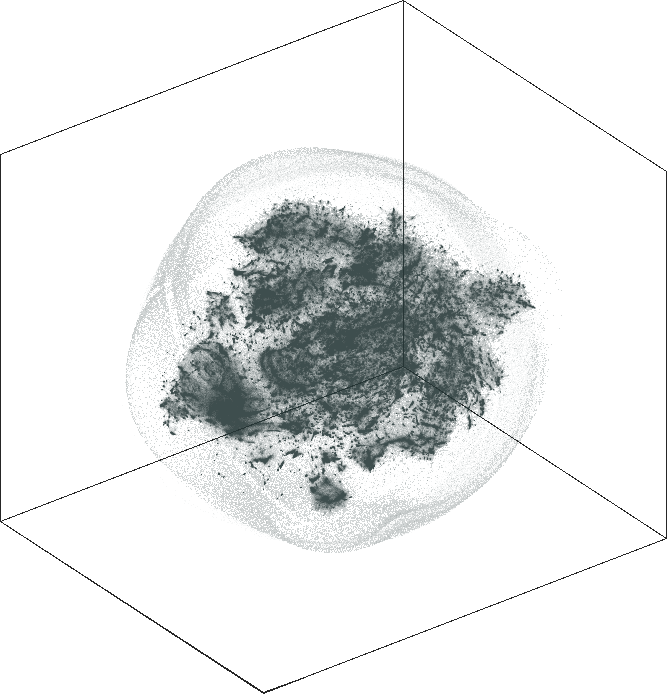
The 3D embeddings depicts better the hierarchical structure of
the LiveJournal network than the corresponding 2D
embeddings. From outwards to inwards we traverse the network from
leaf nodes (lower levels in the hierarchy) to hub nodes (higher
levels in the hierarchy).
| SG-t-SNE | 3D embeddings | |
|---|---|
| Variation with the rescaling parameter \(\lambda\) | |
|
|
| \(\lambda=1.0\) | \(\lambda=10.0\) |
|

|
| \(\lambda=20.0\) | \(\lambda=80.0\) |
kNN graphs (two real-world and two synthetic graphs)
We make comparisons with the conventional t-SNE using kNN graph. SG-t-SNE shows superior embedding results over conventional t-SNE. The rescaling hyper-parameter \(\lambda\) has a larger range of available values comparing to the perplexity, exploring the sparsity of the graph. The perplexity hyper-parameter is limited by the number of neighbors at each vertex in the kNN graph.
Two real-world biological networks and two synthetic networks are shown:
- scRNA-seq of 1.3 million mouse brain cells
- scRNA-seq of 8k Peripheral Blood Mononuclear Cells (PBMCs)
- Lattice graph on Möbius strip
- GEB “braid” book cover
Biological networks
scRNA-seq of 1.3 million mouse brain cells
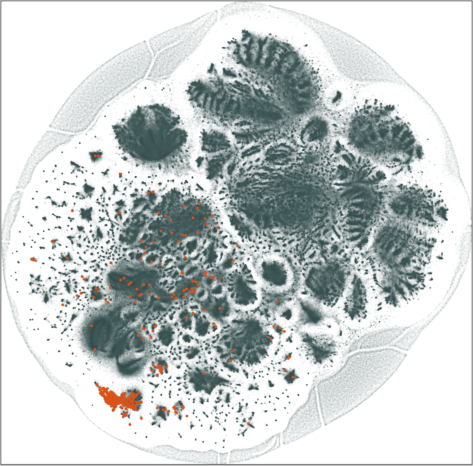
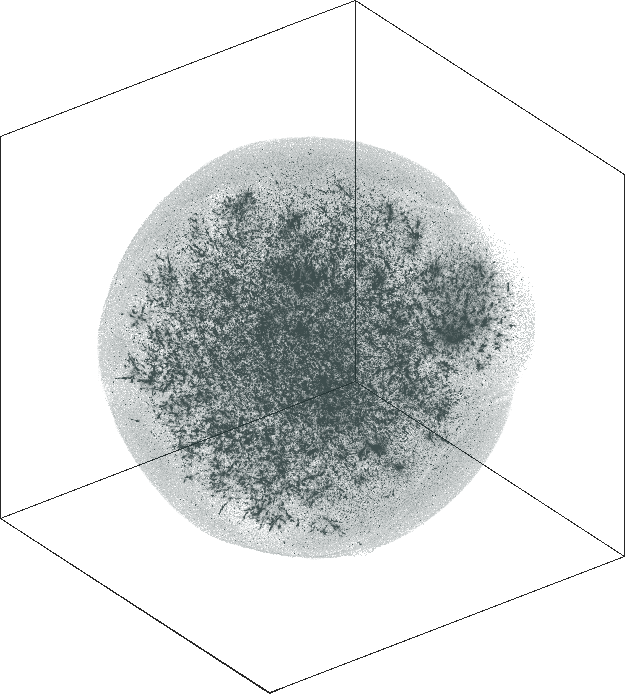
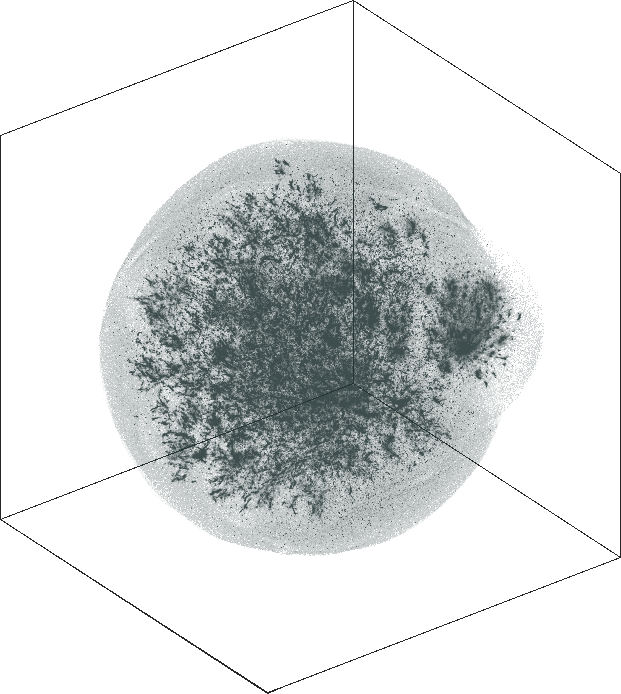
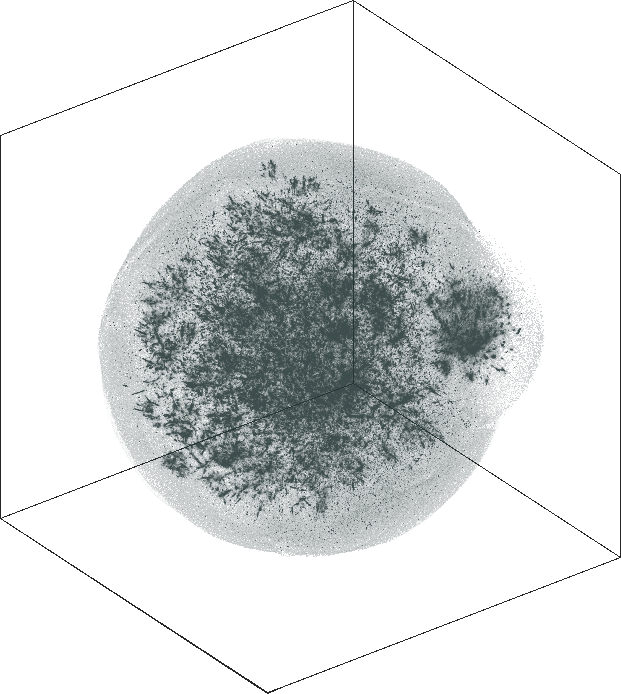
Spaceland(3D) and Flatland(2D) embedding of the kNN graph (\(k = 90\)) associated with \(n =\) 1,306,127 RNA sequences of E18 mouse brain cells. The \(k\)-neighbors (\(k = 90\)) are located in the space of the 50 principle components of the top 1,000 variable genes.
Two cell populations are annotated: GABAergic subtype (Sncg, Slc17a8) in blue and VLMC subtype (Spp1, Col15a1) in red. They are better separated from the rest in 3D embedding.
The SG-t-SNE embedding with \(k = 30\) and \(\lambda = 10\) is visually similar to the t-SNE embedding with \(u=30, k = 90\). The graph used in SG-t-SNE is \(3\times\) sparser than the graph used by t-SNE with a corresponding speedup in the execution time of the attractive forces. The 3D embeddings preserve the neighborhood relatively better, both by visual and quantitative inspection.
| t-SNE | 2D embeddings | ||
|---|---|---|
| Variation with the perplexity parameter \(u\) | ||

|

|

|
| \(u=10, k=30\) | \(u=30, k=90\) | \(u=50, k=150\) |
| SG-t-SNE | 2D embeddings | |||
|---|---|---|---|
| Variation with the rescaling parameter \(\lambda\) | |||
| \(\lambda = 1\) |

|

|

|
| \(\lambda = 10\) |

|

|

|
| \(k = 30\) | \(k = 90\) | \(k = 150\) | |
| t-SNE | 3D embeddings | ||
|---|---|---|
| Variation with the perplexity parameter \(u\) | ||

|

|

|
| \(u=10, k=30\) | \(u=30, k=90\) | \(u=50, k=150\) |
| SG-t-SNE | 3D embeddings | |||
|---|---|---|---|
| Variation with the rescaling parameter \(\lambda\) | |||
| \(\lambda = 1\) |

|

|

|
| \(\lambda = 10\) |

|

|

|
| \(k = 30\) | \(k = 90\) | \(k = 150\) | |
|
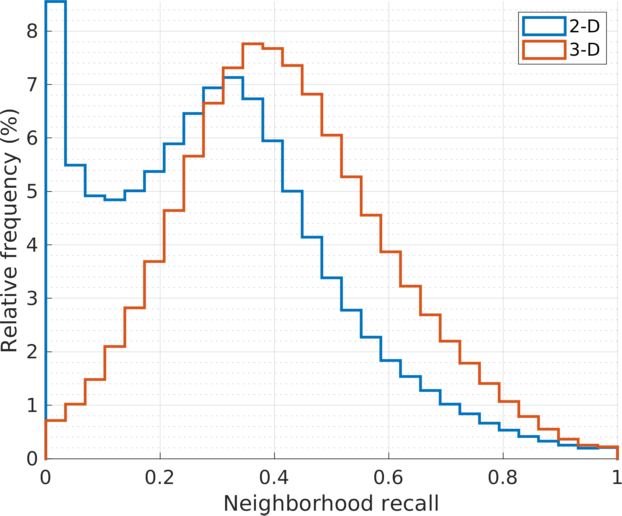
| Histograms of the stochastic \(k\)-neighbors recall values at all vertices, \(\text{recall}(i) = \sum_j \mathbf{P}_{j|i} \cdot b_{ij}\), where \(\mathbf{B}_{k} = [b_{ij}]\) is the adjacency matrix of the \(k\)NN graph of the embedding points \(\{\mathbf{y}_{i} \}\), in Euclidean distance. The stochastic weights \(p_{j|i}\) are common to both 2D and 3D embedding (\(u=30, k=90\)). The histogram for the 3D embedding (in red) shows relatively higher recall scores in larger cell population. The quantitative comparison is consistent with that by visual inspection. |
scRNA-seq of 8k Peripheral Blood Mononuclear Cells (PBMCs)
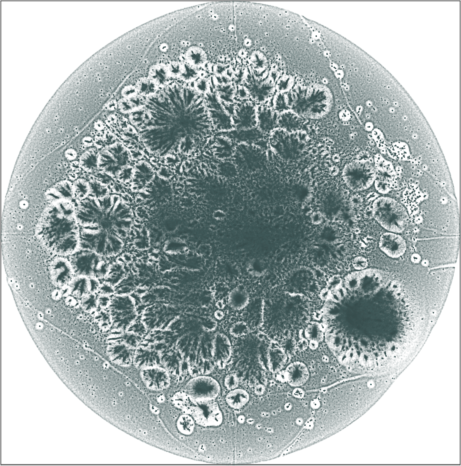
Sub-populations of \(n =\) 8,381 peripheral blood mononuclear cells (PBMC-8k), shown in complementary views. The sub-populations are found by the SD-DP cluster analysis with \(\tau =\) 0.3, from gene expressions of \(d =\) 21,322 genes.
The embeddings by SG-t-SNE from a much sparse matrix are compelling. The SG-t-SNE embedding with with \(k = 30\) and \(\lambda = 10\) is visually similar to the t-SNE embedding with \(u=50\). The sub-populations identified by the SD-DP cluster analysis is consistent with the t-SNE and SG-t-SNE embeeddings. The 3-D embeddings show better separation of the clusters.

|
| The \(k\)NN adjacency matrix, \(k = 30\) with rows/columns permuted so that cells in the same subpopulation are placed together. The column clusters are color coded. Each pixel corresponds to a 16 x 16 matrix block. |
| t-SNE | 2D embeddings | ||
|---|---|---|
| Variation with the perplexity parameter \(u\) | ||

|

|

|
| \(u=10, k=30\) | \(u=30, k=90\) | \(u=50, k=150\) |
| SG-t-SNE | 2D embeddings | |||
|---|---|---|---|
| Variation with the rescaling parameter \(\lambda\) | |||
| \(\lambda = 0.1\) |

|

|

|
| \(\lambda = 1\) |

|

|

|
| \(\lambda = 20\) |

|

|

|
| \(k = 30\) | \(k = 90\) | \(k = 150\) | |
| t-SNE | 3D embeddings | ||
|---|---|---|
| Variation with the perplexity parameter \(u\) | ||

|

|

|
| \(u=10, k=30\) | \(u=30, k=90\) | \(u=50, k=150\) |
| SG-t-SNE | 3D embeddings | |||
|---|---|---|---|
| Variation with the rescaling parameter \(\lambda\) | |||
| \(\lambda = 0.1\) |

|

|

|
| \(\lambda = 1\) |

|

|

|
| \(\lambda = 20\) |

|

|

|
| \(k = 30\) | \(k = 90\) | \(k = 150\) | |
Synthetic networks
Lattice graph on Möbius strip
Essential neighbor and structural connections in a \(k\)NN graph for a Möbius strip lattice, with \(n = 8{,}192\ ( =256\times 32)\) lattice nodes, are obscured or crumbled by a 2D embedding yet principally captured by a 3-D embedding. The embedding of the same graph by the conventional t-SNE within the feasible perplexity range suffers more distortions.

|
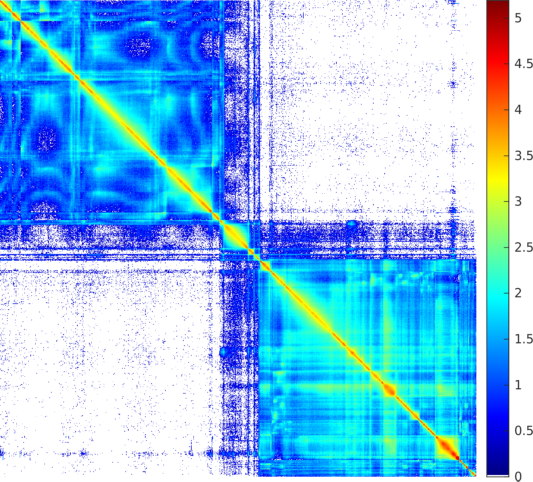
| The stochastic matrix \(P\) of the \(k\)NN graph, \(k=150\), by Euclidean distance, is displayed in a \(512\!\times\! 512\) pixel array. Each pixel represents a \(16\times 16\) matrix block, its value (color coded) is the total sum of the block elements. |
The embeddings by t-SNE and SG-t-SNE, using \(l=1{,}000\) iterations, including \(l_e = 250\) early exaggeration ones with \(\alpha = 12\). The initial coordinates are drawn from a random uniform distribution with variance equal to 1.
| t-SNE | 2D embeddings | ||
|---|---|---|
| Variation with the perplexity parameter \(u\) | ||

|

|

|
| \(u=10, k=30\) | \(u=30, k=90\) | \(u=50, k=150\) |
| SG-t-SNE | 2D embeddings | |||
|---|---|---|---|
| Variation with the rescaling parameter \(\lambda\) | |||
| \(\lambda = 1\) |

|

|

|
| \(\lambda = 10\) |

|

|

|
| \(\lambda = 80\) |

|

|

|
| \(k = 30\) | \(k = 90\) | \(k = 150\) | |
| t-SNE | 3D embeddings | ||
|---|---|---|
| Variation with the perplexity parameter \(u\) | ||

|

|

|
| \(u=10, k=30\) | \(u=30, k=90\) | \(u=50, k=150\) |
| SG-t-SNE | 3D embeddings | |||
|---|---|---|---|
| Variation with the rescaling parameter \(\lambda\) | |||
| \(\lambda = 1\) |

|

|

|
| \(\lambda = 10\) |

|

|

|
| \(\lambda = 80\) |

|

|

|
| \(k = 30\) | \(k = 90\) | \(k = 150\) | |
GEB “braid” book cover
Structural connections of the GEB braid (as seen on the cover of “Gödel, Escher, Bach” book). The 3 letters (G, E, and B) are approximately recovered by SG-t-SNE with the rescaling parameter \(\lambda\) set to 50 or 150, using \(k = 150\) neighbors.

|
| The stochastic matrix \(P\) of the \(k\)NN graph, \(k=150\), by Euclidean distance, is displayed in a \(512\!\times\! 512\) pixel array. Each pixel represents a \(16\times 16\) matrix block, its value (color coded) is the total sum of the block elements. |

|
| The 3D GEB braid data \(N = 8{,}053\), used to generate the \(k\)NN graph. Extra connections are added on ‘loose’ ends to enforce connectivity. |
The embeddings by t-SNE and SG-t-SNE, using \(l=1{,}000\) iterations, including \(l_e = 500\) early exaggeration ones with \(\alpha = 12\). The initial coordinates are drawn from a random uniform distribution with variance equal to 1.
| t-SNE | 2D embeddings | ||
|---|---|---|
| Variation with the perplexity parameter \(u\) | ||

|

|

|
| \(u=10, k=30\) | \(u=30, k=90\) | \(u=50, k=150\) |
| SG-t-SNE | 2D embeddings | |||
|---|---|---|---|
| Variation with the rescaling parameter \(\lambda\) | |||
| \(\lambda = 1\) |

|

|

|
| \(\lambda = 10\) |

|

|

|
| \(\lambda = 80\) |

|

|

|
| \(k = 30\) | \(k = 90\) | \(k = 150\) | |
| t-SNE | 3D embeddings | ||
|---|---|---|
| Variation with the perplexity parameter \(u\) | ||

|

|

|
| \(u=10, k=30\) | \(u=30, k=90\) | \(u=50, k=150\) |
| SG-t-SNE | 3D embeddings | |||
|---|---|---|---|
| Variation with the rescaling parameter \(\lambda\) | |||
| \(\lambda = 1\) |

|

|

|
| \(\lambda = 10\) |

|

|

|
| \(\lambda = 80\) |

|

|

|
| \(k = 30\) | \(k = 90\) | \(k = 150\) | |
Performance
Execution time

|
| Multiple comparisons in execution time for embedding of kNN graphs (\(k =\) 30,90) with 1,306,127 nodes as single-cell RNA sequences of E18 mouse brain cells. Each embedding uses 1,000 iterations and maintains the same approximation level \(10^{-6}\). (a) In total time, with the same sparsity parameter \(k\), 3D embeddings by t-SNE-Π take less time to finish \(1.5\times\) operations in comparison to 2D embeddings by t-SNE, on each of the computers used. (b) In memory usage, t-SNE-Π does not augment grid size and thereby uses less memory space. (c) The computation with sparse matrix PQ dominates the t-SNE time on computers with lower bandwidth. The embedding by SG-t-SNE on a sparser graph (\(k = 30\)) reduces the PQ time further, with results comparable to that by t-SNE on the graph \(3\times\) as dense. The combined speedup of SG-t-SNE-Π is 5.3x on the Core i7-6700 workstation and 4.5x on the Core i7-4558U MacBook Pro (Late 2013). The code of t-SNE-Π is to be optimized; a new version that utilizes the graphics card, if any, is in development. |
Data permutation for repulsive interactions

|

|
| Sequential execution | Parallel execution (4 threads) |
|
Comparison in sequential and parallel execution times of
|
|
Architecture specification

|
| Architecture specifications of the three computers used in the experiments. The first computer is a MacBook Pro (Late 2013), the second one is a desktop and the third computer is a server. Memory bandwidth is measured with the STREAM benchmark copy function running in parallel. The execution time results match the expected performance due to the bandwidth and clock ratios between each computer. |
Supplementary: relating the adjacency matrix to the graph embedding matrix in SG-t-SNE1
For graph embedding with SG-t-SNE, a graph \(G\) is represented and provided by
its adjacency matrix \(\mathbf{A}\) at input, not limited to
a pairwise distance or similarity matrix as in SNE or
t-SNE. Matrix \(\mathbf{A}\) may be very sparse for a
large graph, while a distance/similarity matrix is full, with
all-to-all connections. In SG-t-SNE, similar to
SNE, we convert the input matrix into a stochastic
guidance matrix \(\mathbf{P}_c\)
for graph embedding, with a distinction. We allow \(\mathbf{P}_c\) to preserve the
sparsity in network connectivity, i.e., \(\mathbf{P}_c\) has the same
zero-and-nonzero pattern as \(\mathbf{A}\). We maintain that graph
embedding matrix \(\mathbf{P}_c\)
is column-stochastic, and the non-zero elements in each column are
not constant.
We describe the relationship between \(\mathbf{P}_c\) and \(\mathbf{A}\) in two typical application cases. We may assume that \(\mathbf{A}\) has no zero columns.
Matrix \(\mathbf{A}\) is nonnegatively and unequally weighted, a higher weight on an edge \((u,v)\) indicating a closer affinity between node \(u\) and node \(v\). In this case, \(\mathbf{P}_c\) can be simply a column-stochastic version of \(\mathbf{A}\), namely, the columns are scaled so that each and every column sums to \(1\).
Matrix \(\mathbf{A}\) is unweighted, binary valued with \(0\)s and \(1\)s. In this case, we introduce stochastic weights in \(\mathbf{P}_c\) to capture and reflect the similarity or discrepancy in local topological connectivity in graph \(G\). There are more than one ways to capture such variation. We describe a simple method deployed in the current
SG-t-SNEimplementation.2 For each pair of linked nodes \(u\) and \(v\), we assign the following Jaccard affinity score on the edge \((u,v)\), \[\mathbf{P}_c(u,v) = c(v) \cdot \mathbf{A}(u,v) \cdot \frac{ | \mathcal{N}(u) \cap \mathcal{N}(v) | } { | \mathcal{N}(u) \cup \mathcal{N}(v) | },\] where \(\mathcal{N}(v)\) denotes the one-hop neighborhood of node \(v\), \(|S|\) denotes the cardinality of a discrete set \(S\), and \(c(v)\) normalizes the sum of column-\(v\) to \(1\). The affinity score of \(u\) to \(v\) is higher if \(u\) shares more common neighbors with \(v\) among the nodes adjacent to either \(u\) or \(v\). The neighborhood definition can be changed, such as from one hop to two hops.
When the variation in the Jaccard scores is small, it indicates a high degree of symmetry in graph \(G\). For instance, the scores are constant over any clique, any 2D torus, or the graph of fullerene \(C_{60}\). Such graphs may be embedded well with the geometric embedding method via the graph Laplacian.
There is a meaningful way to convert Case (b) to Case (a) at
the user-interface level, without invoking the internal
differentiation in local topology. For example, \(\mathbf{A}+\mathbf{A}^2\) represents
the node connectivity within two-hop walks on \(G\). Or one may use a graph augmented
by \(\sum_{k=1}^{h} \beta_k
\mathbf{A}^k\) within \(h\)-hops, \(h>1.\) The hop-weights \(\beta_k\) may decrease with the
increase of \(k\). It is
beneficial in a discriminative or exploratory graph analysis to
use SG-t-SNE not only on graph \(G\) but also on a few other graphs
induced from or related to \(G\).
In an extreme case, one can get from \(G\) the geodesic distance matrix
without or with thresholding on the pairwise distances.
In any case, we also associate \(\mathbf{P}_c\) with a neighborhood scaling parameter denoted as \(\lambda\). The user can alter the default setting. The parameter adjusts the effective neighborhood range by non-linearly rescaling the weights to concentrate more on closer neighbors or spread out to reach farther neighbors.
Precursor works
L. van der Maaten and G. Hinton, “Visualizing data using t-SNE,” Journal of Machine Learning Research, vol. 9, no. Nov, pp. 2579–2605, 2008.
L. van der Maaten, “Accelerating t-SNE using tree-based algorithms,” Journal of Machine Learning Research, vol. 15, no. Oct, pp. 3221–3245, 2014. [Code]
G. C. Linderman, M. Rachh, J. G. Hoskins, S. Steinerberger, and Y. Kluger, “Fast interpolation-based t-SNE for improved visualization of single-cell RNA-seq data,” Nature Methods, vol. 16, no. 3, pp. 243– 245, 2019.
Dimitris Floros, Tiancheng Liu, Nikos Pitsianis and Xiaobai Sun, “Sparse Dual of the Density Peaks Algorithm for Cluster Analysis of High-Dimensional Data,” Proc. 2018 IEEE High Performance Extreme Computing Conference (HPEC), 2018.
Data sources
J. Yang and J. Leskovec, “Defining and evaluating network communities based on ground-truth,” Knowledge and Information Systems, vol. 42, no. 1, pp. 181–213, 2015.
“Transcriptional profiling of 1.3 million brain cells with the Chromium Single Cell 3’ solution,” 10x Genomics LIT000015 Chromium Million Brain Cells Application Note, 2017.
G. X. Y. Zheng, J. M. Terry, P. Belgrader, P. Ryvkin, Z. W. Bent, R. Wilson, S. B. Ziraldo, T. D. Wheeler, G. P. McDermott, J. Zhu, M. T. Gregory, J. Shuga, L. Montesclaros, J. G. Underwood, D. A. Masquelier, S. Y. Nishimura, M. Schnall-Levin, P. W. Wyatt, C. M. Hindson, R. Bharadwaj, A. Wong, K. D. Ness, L. W. Beppu, H. J. Deeg, C. McFarland, K. R. Loeb, W. J. Valente, N. G. Ericson, E. A. Stevens, J. P. Radich, T. S. Mikkelsen, B. J. Hindson, and J. H. Bielas, “Massively parallel digital transcriptional profiling of single cells,” Nature Communications, vol. 8, p. 14049, 2017.
Acknowledgments
The experiments were carried out with the assistance of Pantazis Vouzaksakis and Xenofon Theodoridis.